Reproducible Statistical Publications with Quarto

uRos 2026 logo: a pink hexagon with the Eiffel Tower and an R flag, urosconf.org

Christophe Dervieux

Posit PBC

November 19, 2026

Friends in official statistics:

“Quarto? I haven’t seen it used much in official statistics.”

Friends in official statistics:

“Quarto? I haven’t seen it used much in official statistics.”

Every uRos since 2017
has a talk about publishing statistics

Recurring publications, automated Your institute’s look Less manual work

Programs read from 2014 to 2026: 532 items, about 35 publishing talks. Method, code and data: analysis/ in the slides repository.

Thursday, 17:50

The key figure is wrong, and the release is tomorrow.

R code 245.0514.7

Word report 245.0514.7

PDF 245.0514.7

Chart 245.0514.7

Web page 245.0514.7

Press release 245.0514.7

One is still wrong.

Thursday, 17:50

One source file

Word report

PDF

Chart

Web page

Press release

Fix it once

Quarto …

…is an open-source, scientific, and technical publishing system
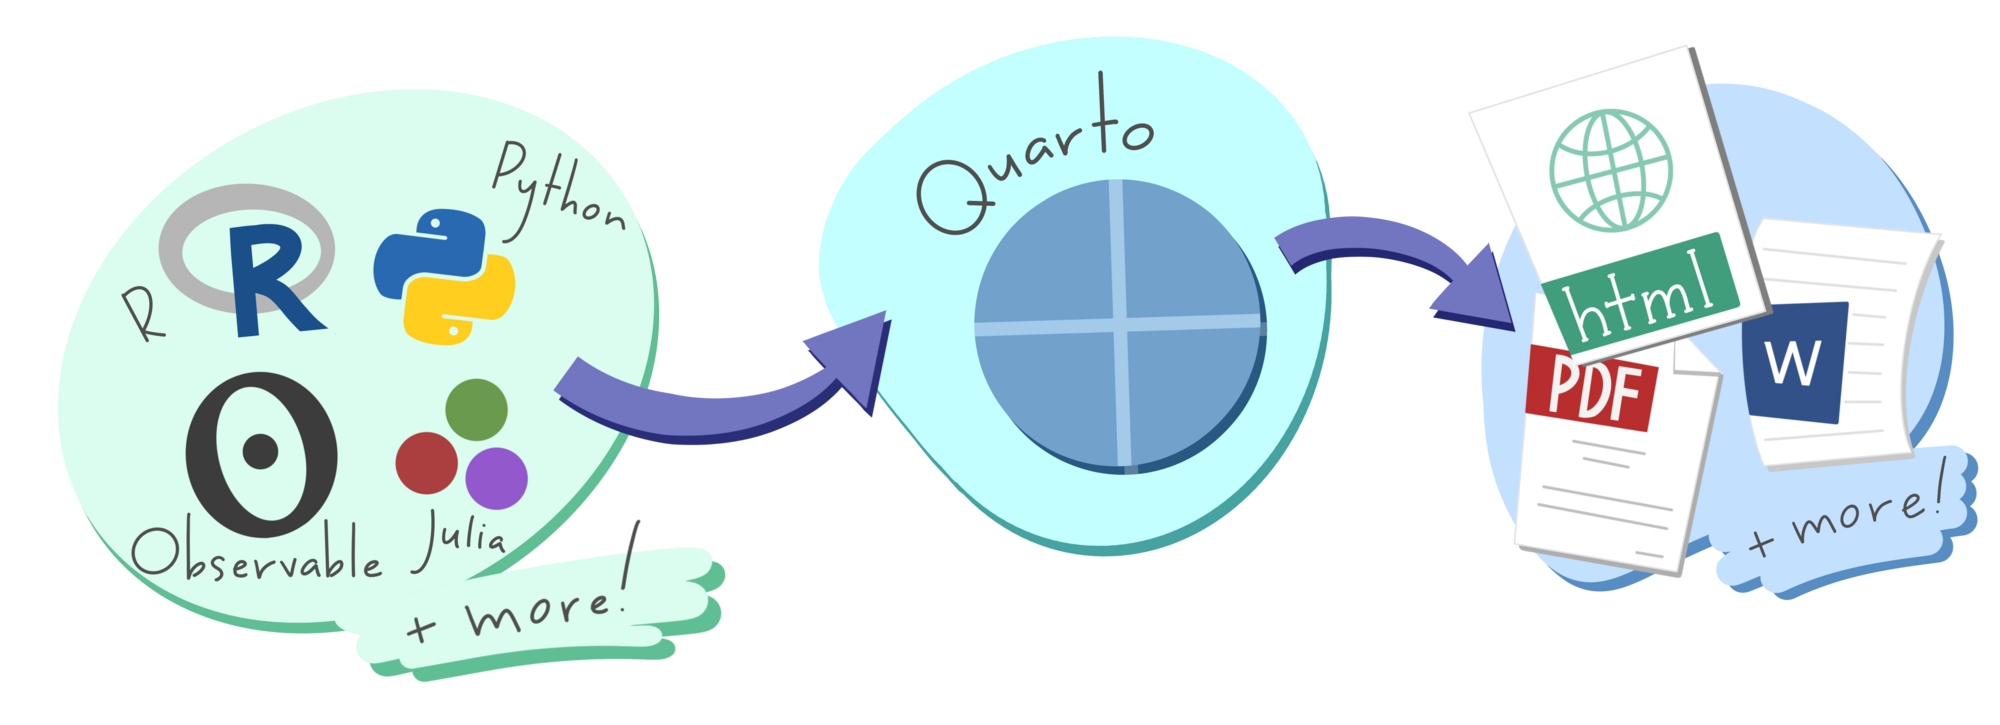
Schematic: R, Python, Observable, Julia and other languages go into Quarto, which makes HTML, PDF, Word and other documents.

Artwork from “Hello, Quarto” keynote by Julia Lowndes and Mine Çetinkaya-Rundel, presented at RStudio Conference 2022. Illustrated by Allison Horst.

Quarto renders text and R code into this bulletin
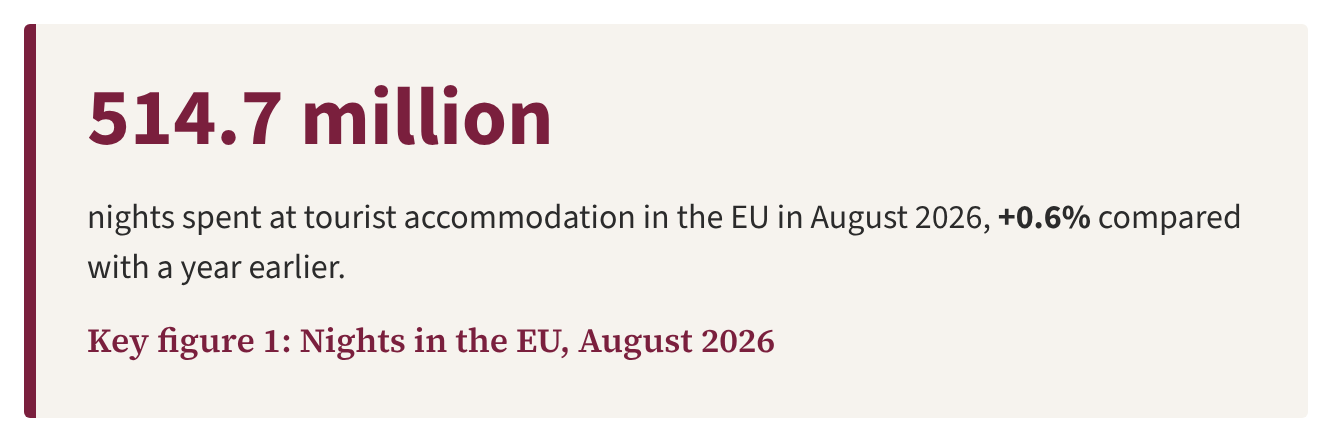
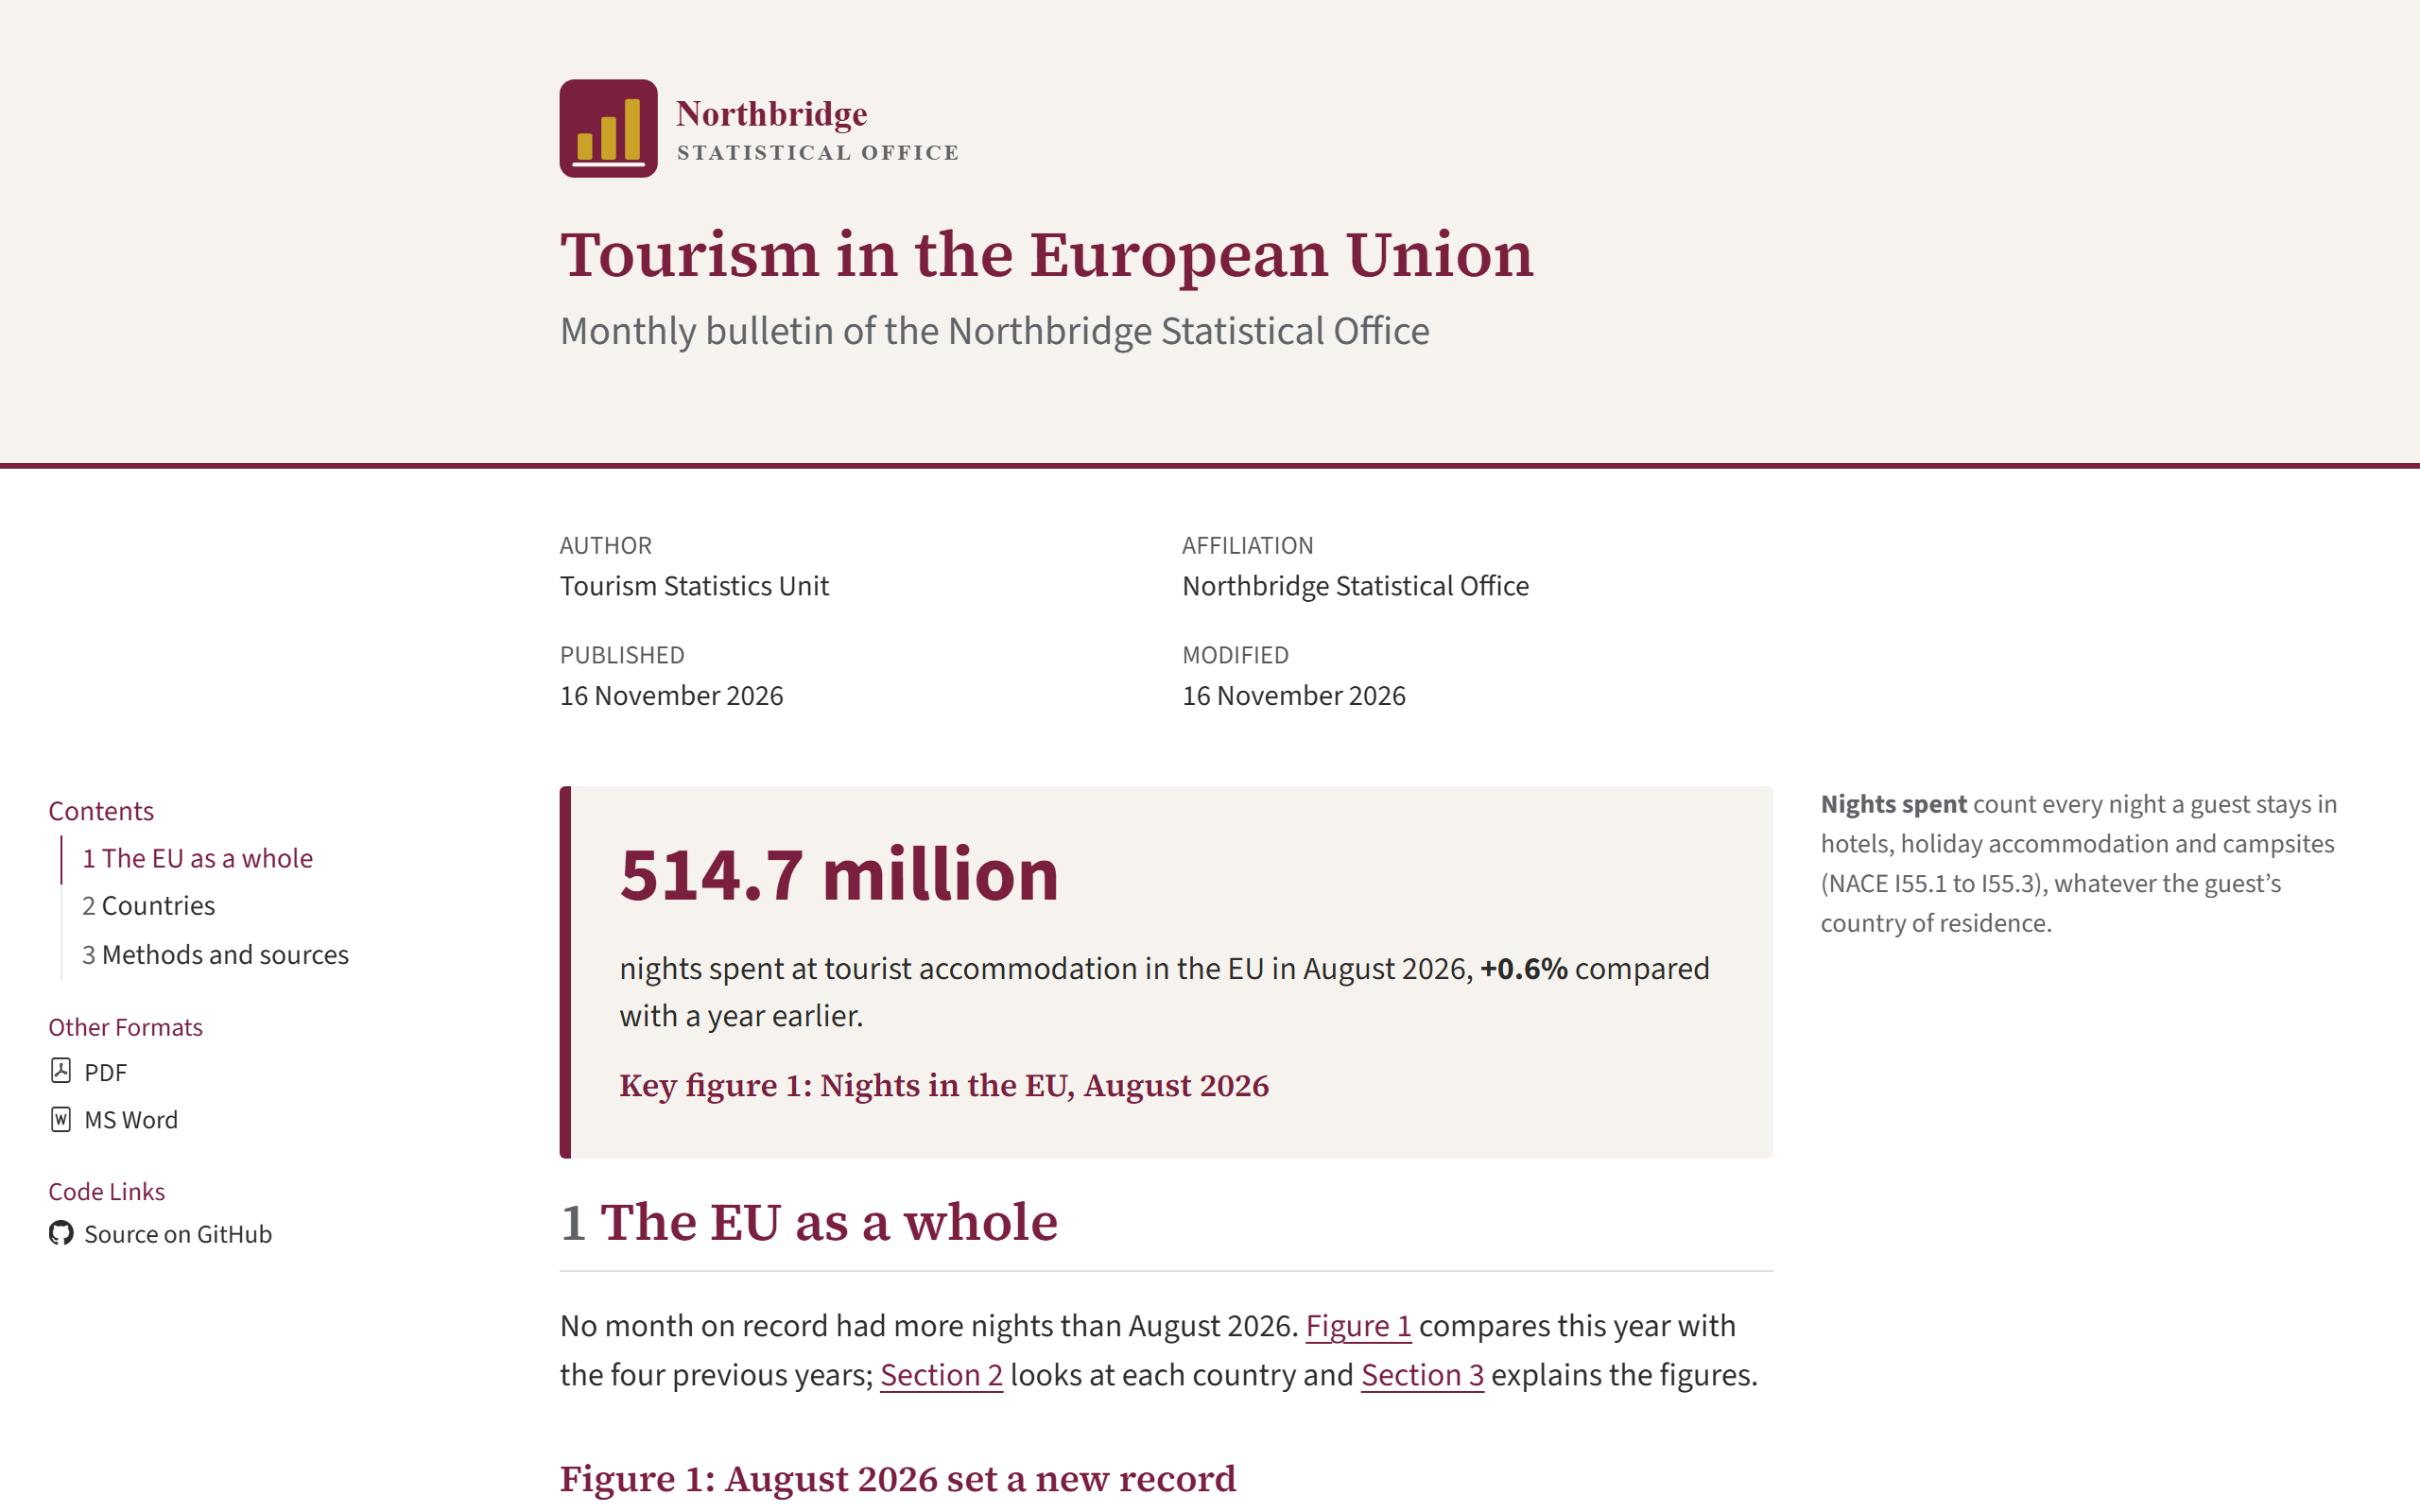
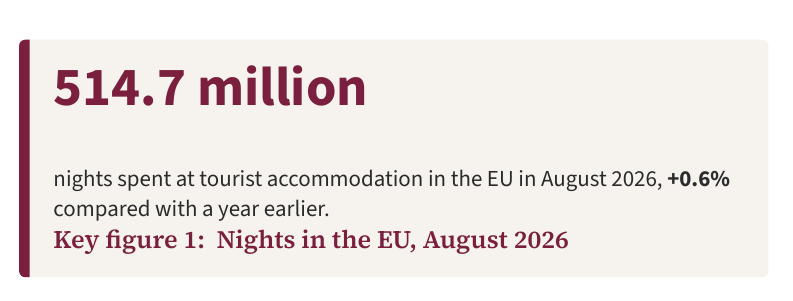
Key figure box of the HTML bulletin: 514.7 million nights spent at tourist accommodation in the EU in August 2026, +0.6% compared with a year earlier.

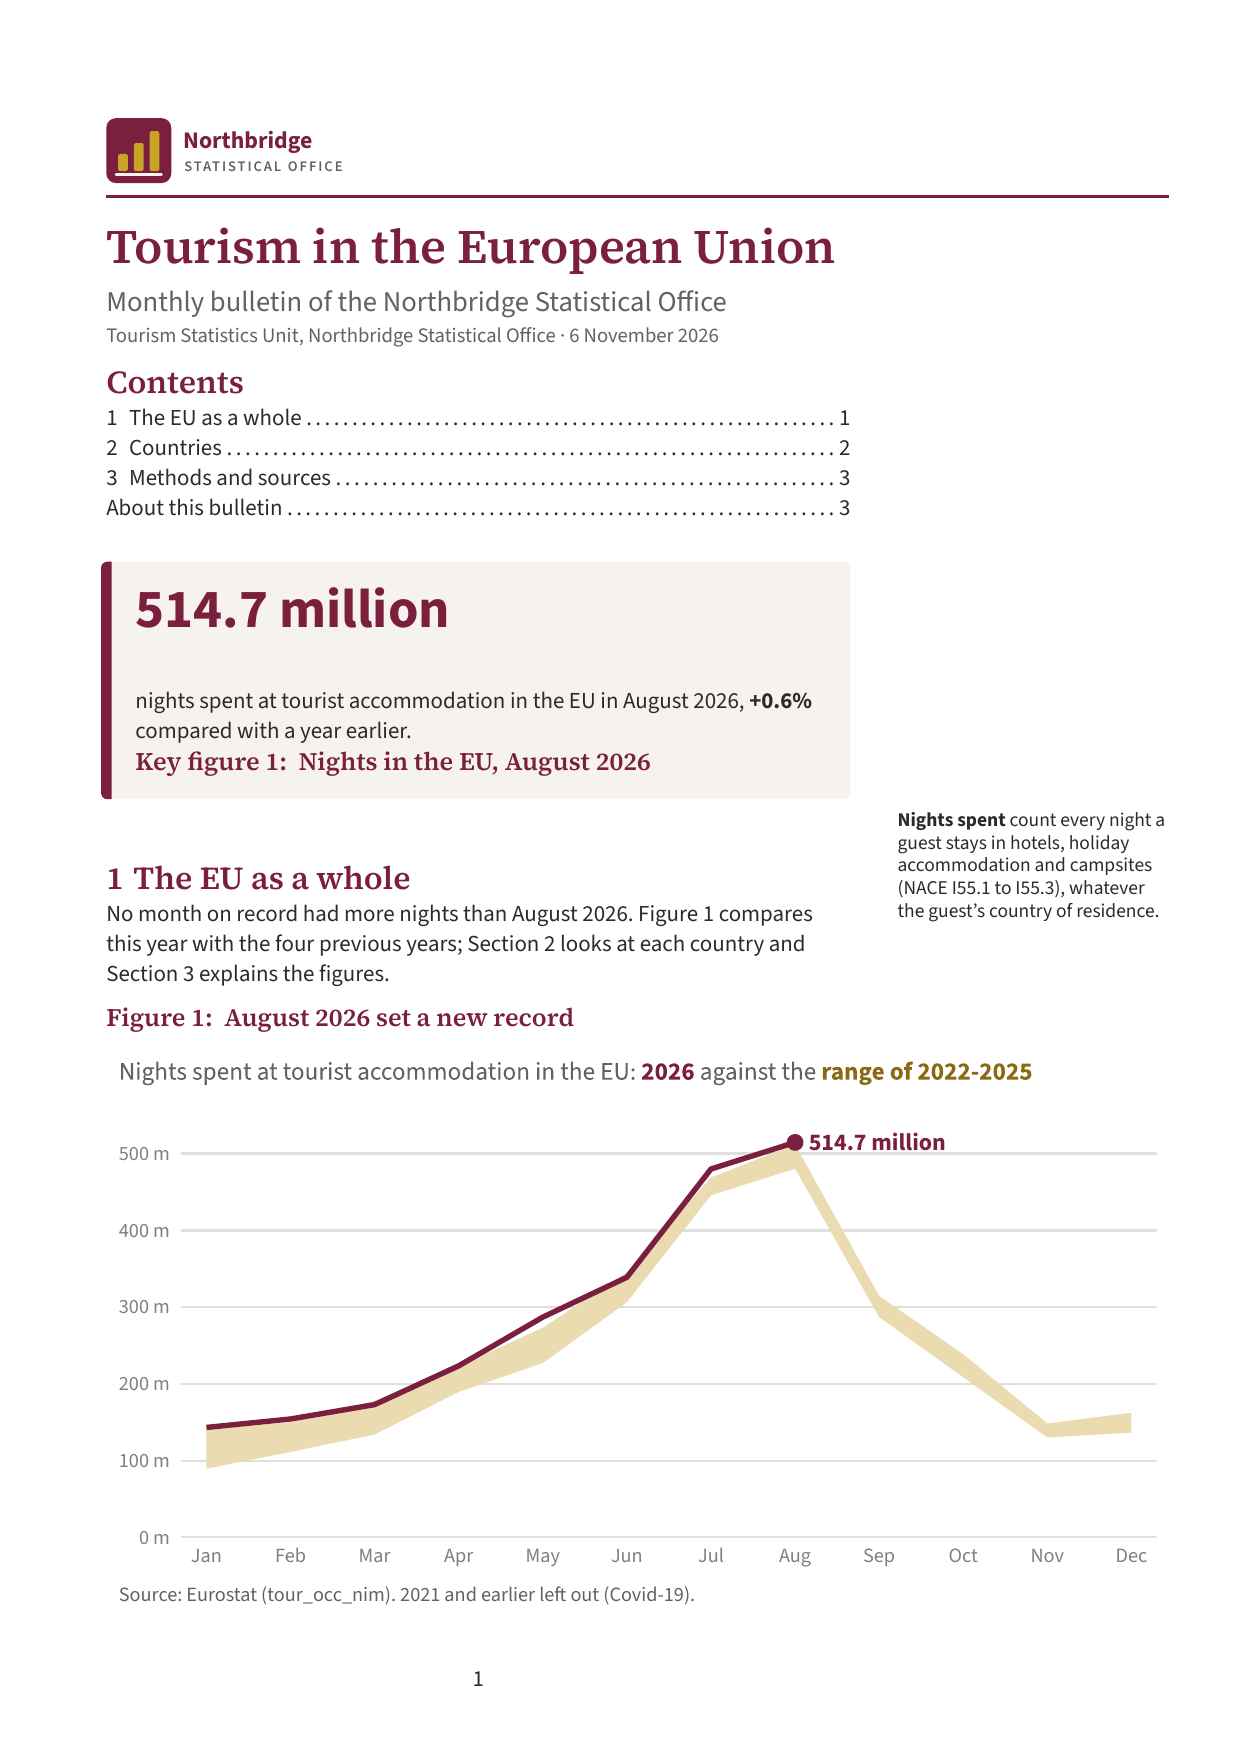
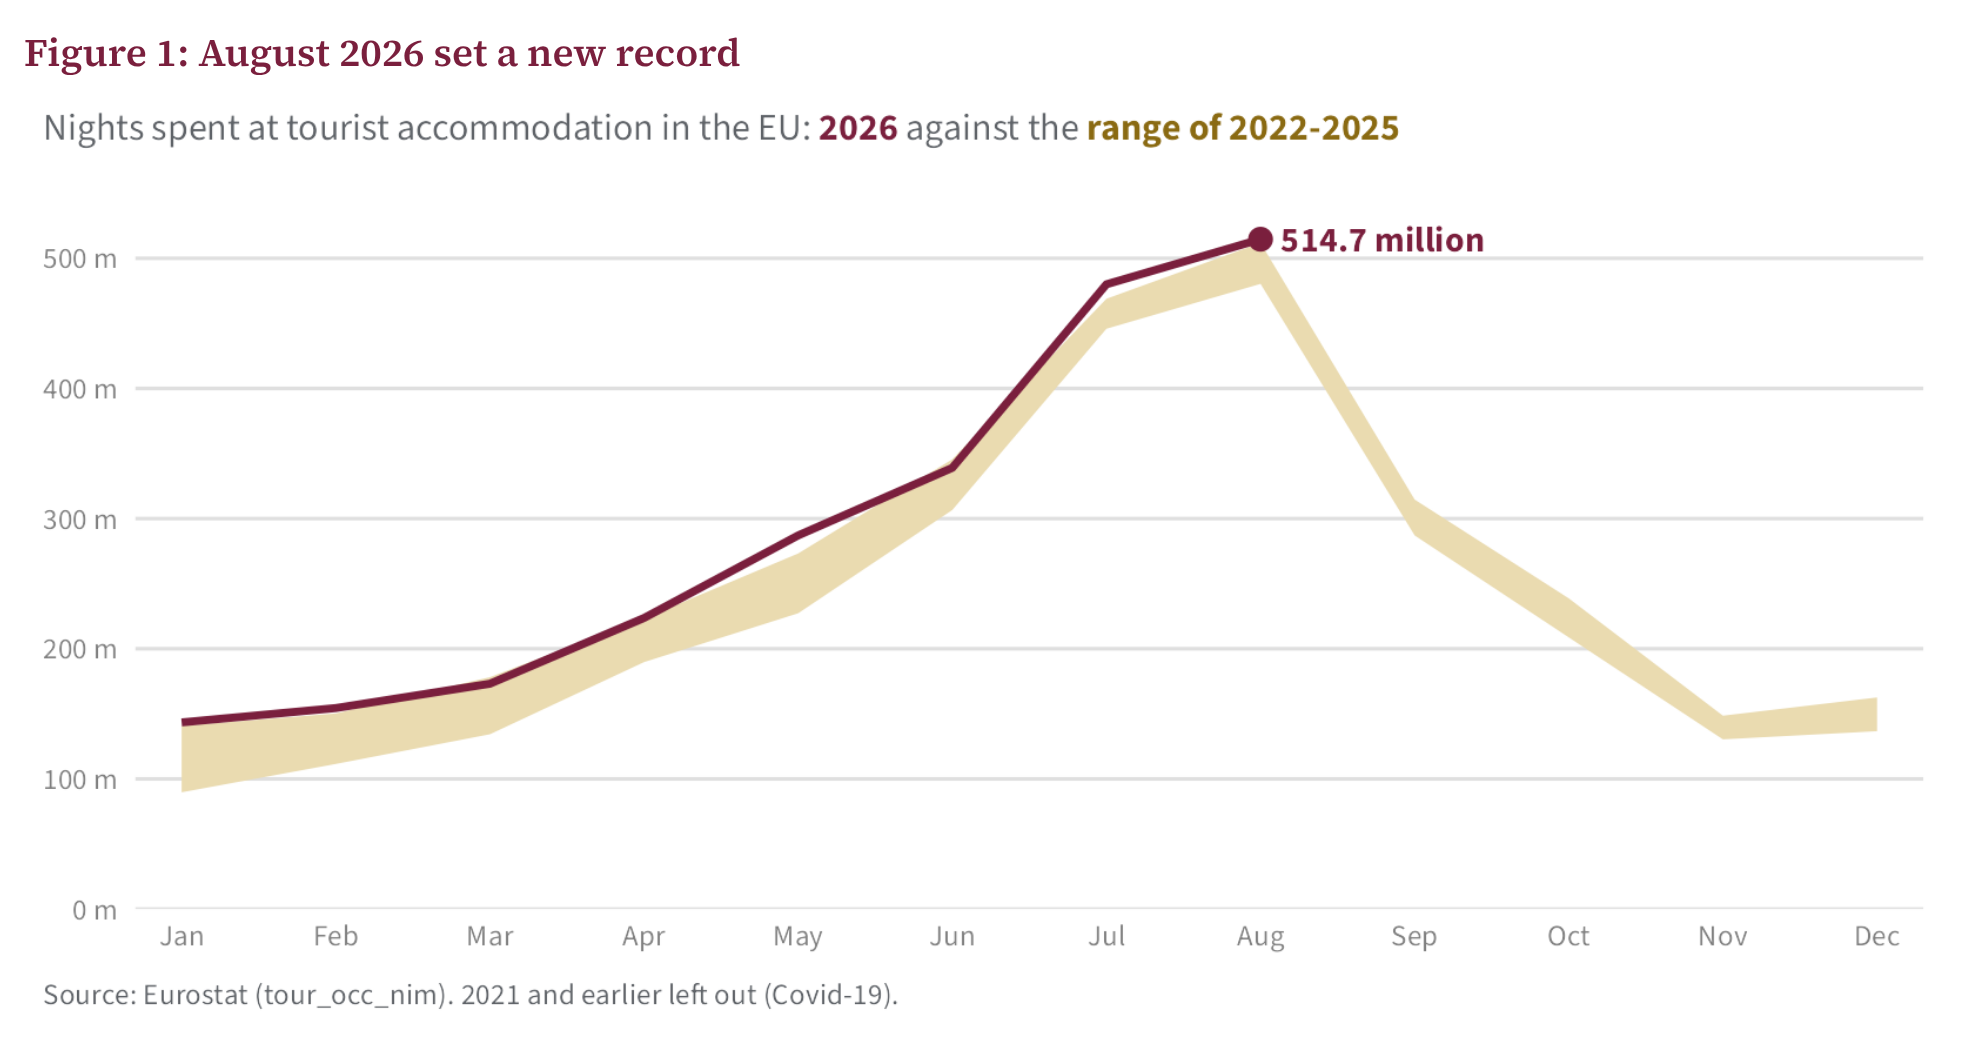
Figure 1 of the HTML bulletin, titled 'August 2026 set a new record'. Line chart of monthly nights in the EU, the 2026 line above the 2022-2025 range, August labelled 514.7 million.

Quarto renders text and R code into this bulletin
Key figure box of the HTML bulletin: 514.7 million nights spent at tourist accommodation in the EU in August 2026, +0.6% compared with a year earlier.

Figure 1 of the HTML bulletin, titled 'August 2026 set a new record'. Line chart of monthly nights in the EU, the 2026 line above the 2022-2025 range, August labelled 514.7 million.

bulletin.html, August 2026

Key figure: 514.7 million nights

Chart and caption come from the same R code

Nobody typed 514.7

The R code you already have

library(eurostat)
library(ggplot2)

nights <- get_eurostat(
  "tour_occ_nim",
  filters = list(
    geo = "EU27_2020",
    unit = "NR",
    nace_r2 = "I551-I553",
    c_resid = "TOTAL"
  )
)
nights <- na.omit(nights)
latest <- nights[which.max(nights$time), ]

ggplot(nights, aes(time, values)) + geom_line()

Shortened for the slide. Full source in cderv/uros2026-quarto-example.

Put it in code cells, write the text around them

```{r}
library(eurostat)
library(ggplot2)
nights <- get_eurostat(
  "tour_occ_nim",
  filters = list(
    geo = "EU27_2020",
    unit = "NR",
    nace_r2 = "I551-I553",
    c_resid = "TOTAL"
  )
)
nights <- na.omit(nights)
latest <- nights[which.max(nights$time), ]
```

Nights spent in tourist accommodation, EU, by month:

```{r}
ggplot(nights, aes(time, values)) + geom_line()
```

A .qmd file is plain text. R code in code cells, your text in Markdown between them.

Tell Quarto what each cell is

```{r}
#| echo: false
library(eurostat)
library(ggplot2)
nights <- get_eurostat(
  "tour_occ_nim",
  filters = list(
    geo = "EU27_2020",
    unit = "NR",
    nace_r2 = "I551-I553",
    c_resid = "TOTAL"
  )
)
nights <- na.omit(nights)
latest <- nights[which.max(nights$time), ]
```

Nights spent in tourist accommodation, EU, by month:

```{r}
#| label: fig-trend
#| fig-cap: "Nights spent at tourist accommodation, EU"
ggplot(nights, aes(time, values)) + geom_line()
```

Write R code inside the sentence

```{r}
#| echo: false
library(eurostat)
library(ggplot2)
nights <- get_eurostat(
  "tour_occ_nim",
  filters = list(
    geo = "EU27_2020",
    unit = "NR",
    nace_r2 = "I551-I553",
    c_resid = "TOTAL"
  )
)
nights <- na.omit(nights)
latest <- nights[which.max(nights$time), ]
```

The EU recorded `{r} round(latest$values / 1e6, 1)` million nights.

```{r}
#| label: fig-trend
#| fig-cap: "Nights spent at tourist accommodation, EU"
ggplot(nights, aes(time, values)) + geom_line()
```

Quarto is a command line tool (CLI)

quarto render bulletin.qmd

Or one button in Positron, RStudio, VS Code
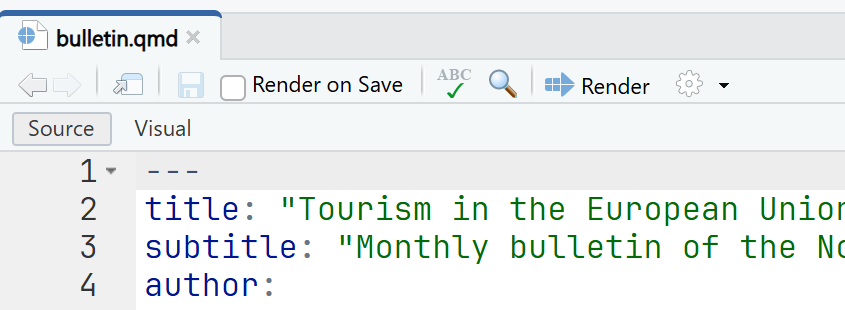
Top of the Positron editor with bulletin.qmd open: the tab, the toolbar with the Preview button, and the first lines of the YAML header.

Positron

Top of the RStudio editor with bulletin.qmd open: the tab, the toolbar with the Render button, and the first lines of the YAML header.

RStudio

Output formats at the top of the file

---
title: Tourism in the EU
format: html
---

Output formats at the top of the file

---
title: Tourism in the EU
format:
  html: default
  typst: default # PDF, no LaTeX to install
---

Output formats at the top of the file

---
title: Tourism in the EU
format:
  html: default
  typst: default # PDF, no LaTeX to install
  docx: default
---

The same command…

quarto render bulletin.qmd

… now writes bulletin.html, bulletin.pdf and bulletin.docx

For the web

Top of the HTML bulletin in a browser: the Northbridge Statistical Office banner with its logo, the title Tourism in the European Union, a contents sidebar with links to the PDF and Word versions and to the source on GitHub, and the key figure 514.7 million in a box.

For print

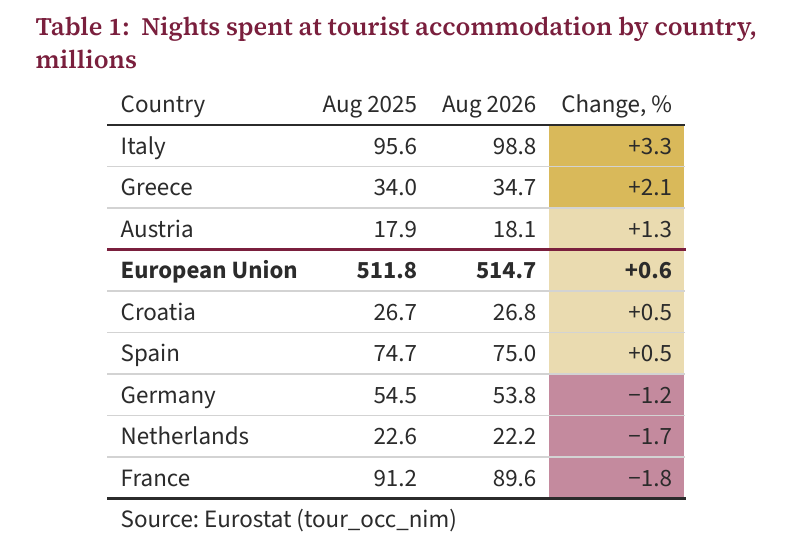
A gt table in HTML and PDF

```{r}
#| label: tbl-countries
#| tbl-cap: >
#|   Nights spent at tourist accommodation
#|   by country, millions
gt(tab) |>
  fmt_number(
    columns = c(before, now),
    scale_by = 1e-6,
    decimals = 1
  ) |>
  fmt_number(
    columns = change,
    decimals = 1,
    force_sign = TRUE
  )
```

Shortened for the slide. Colors and the bold EU row are in the full source.
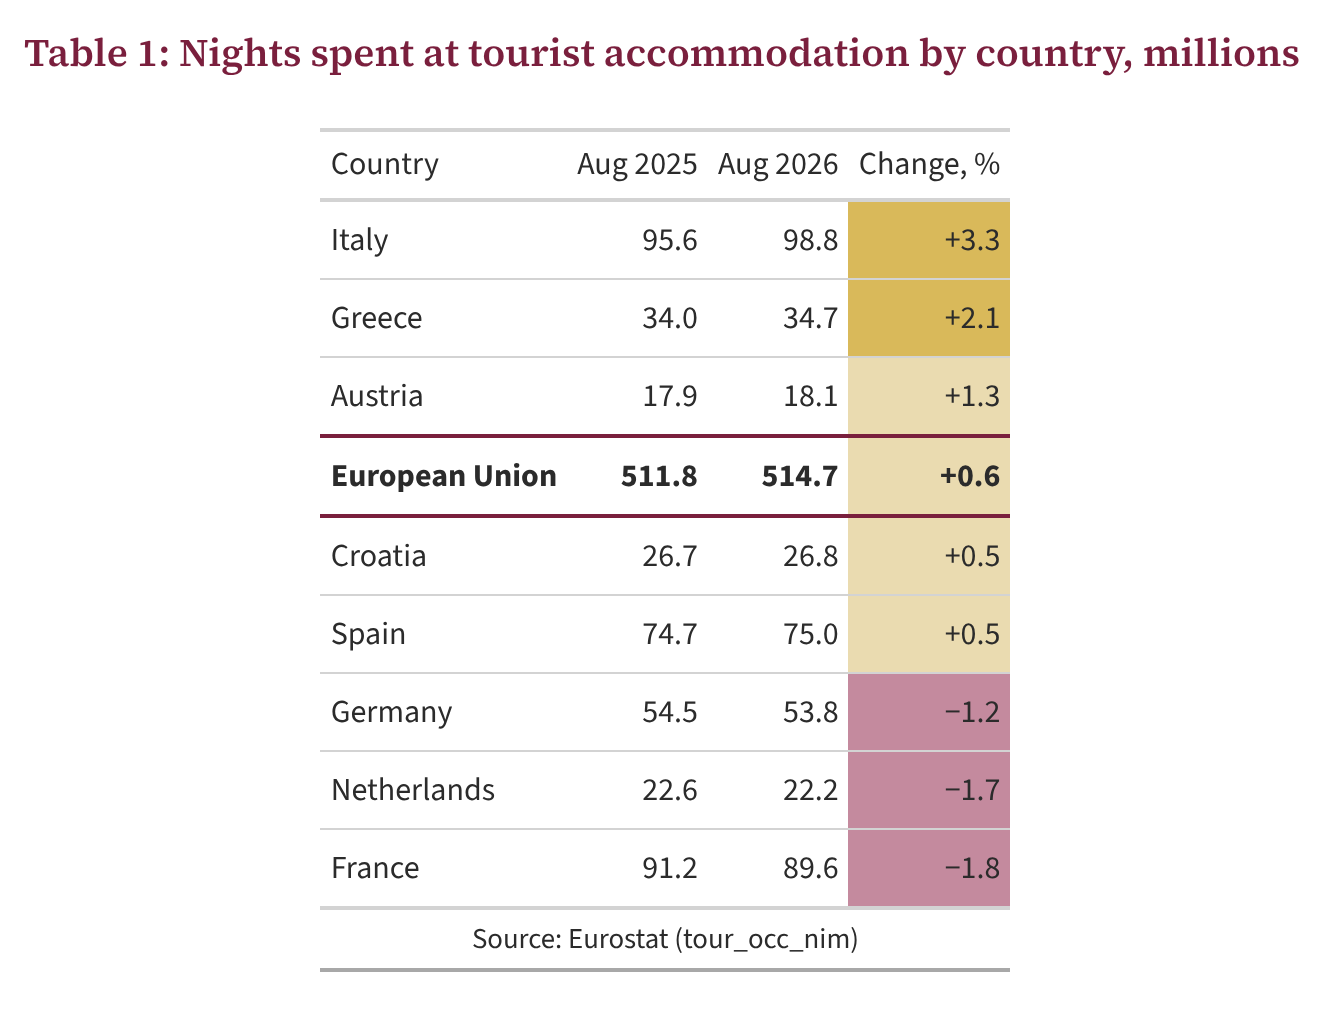
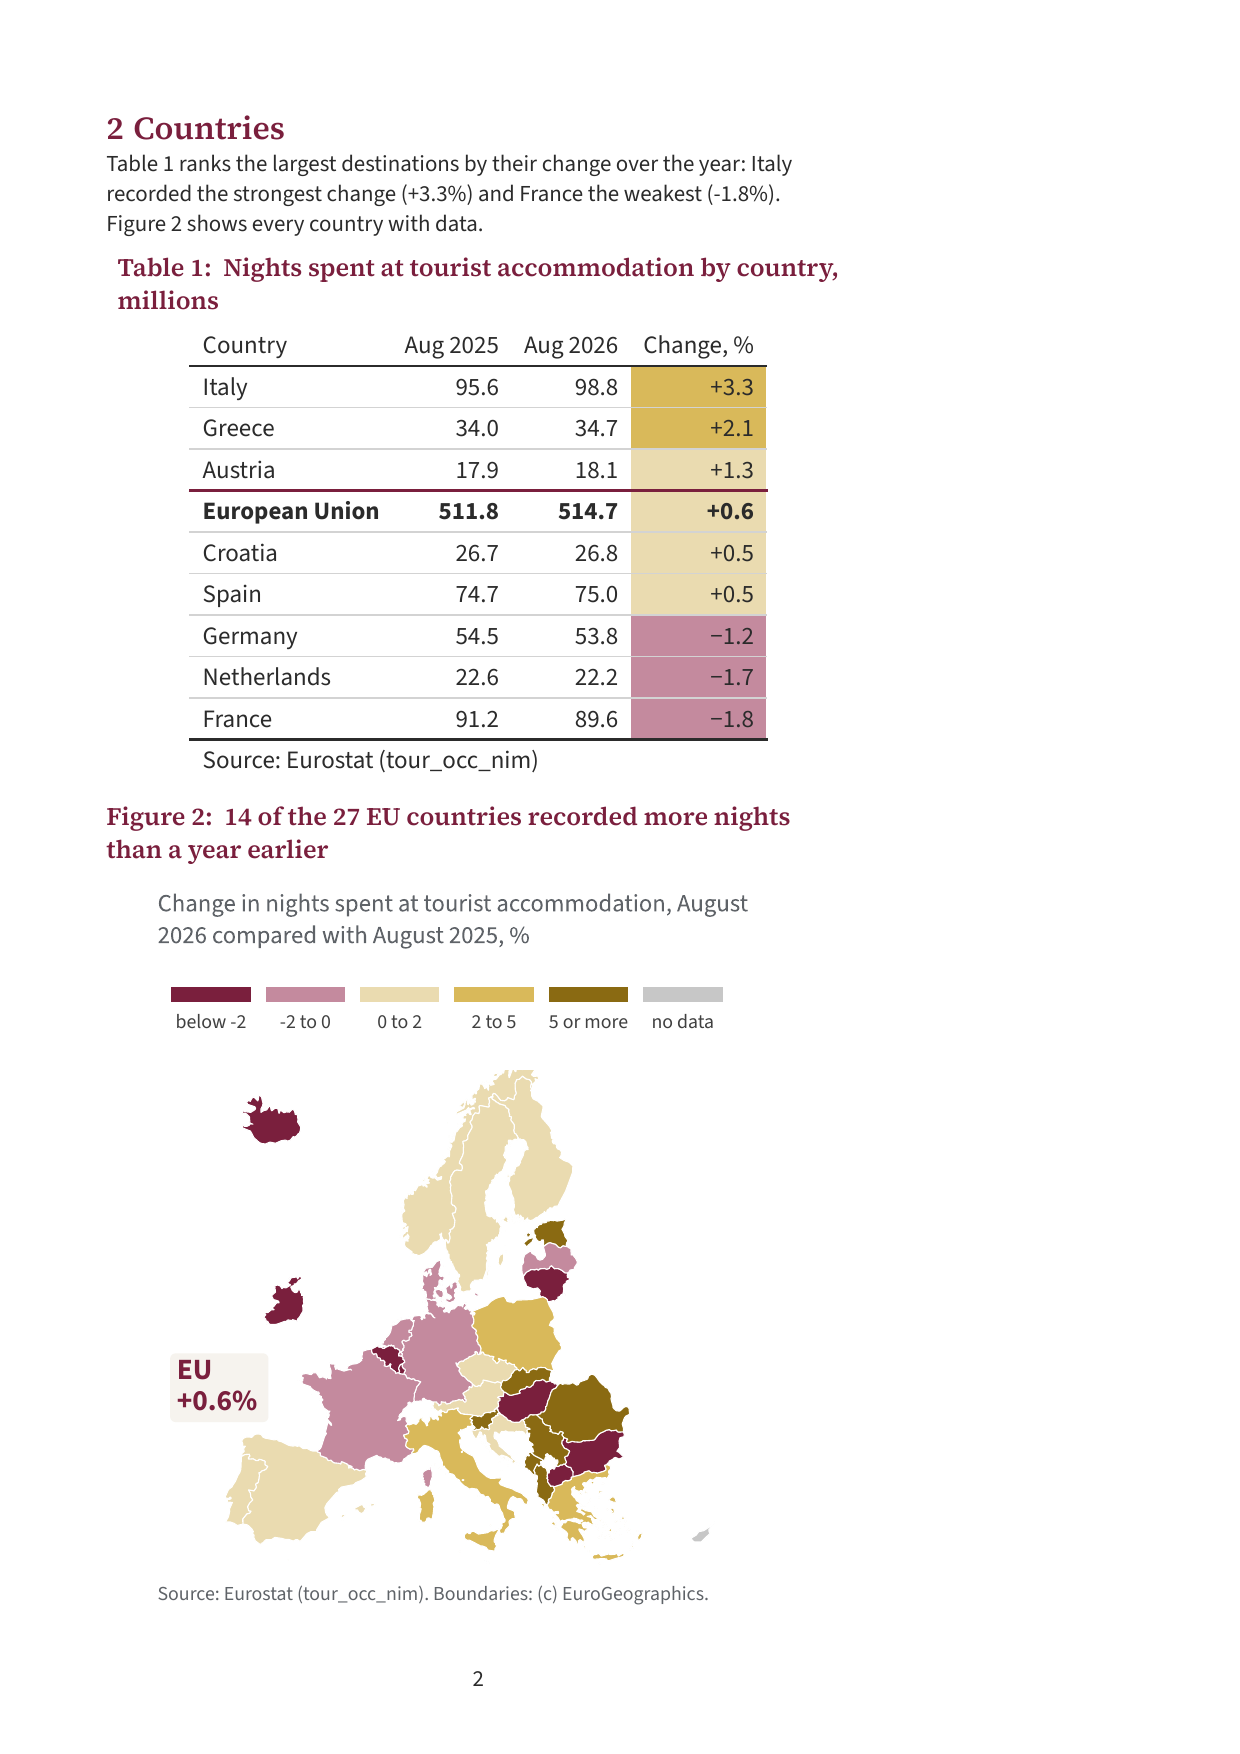
The same Table 1 in the PDF bulletin, with the same numbers, lines and colors.

bulletin.pdf

Cross-references are numbered for you

No month on record had more nights than August 2026. @fig-trend compares
this year with the four previous years; @sec-countries looks at each
country and @sec-methods explains the figures.

The sentence in the HTML bulletin, with links: Figure 1 compares this year with the four previous years; Section 2 looks at each country and Section 3 explains the figures.

Your institute’s look in _brand.yml

_brand.yml
meta:
  name: Northbridge Statistical Office
logo:
  images:
    mark: brand/nso-mark.svg
color:
  primary: "#7a1f3d"
typography:
  base: Source Sans 3
  headings: Source Serif 4

brand.yml · Brand in Quarto · Logos

The HTML bulletin in the institute's colors: a stone banner, the burgundy logo and title in Source Serif 4, body text in Source Sans 3.

Page 1 of the PDF bulletin laid over it, with the same logo, colors and fonts.

Quarto checks your outputs for accessibility

format:
  html:
    axe: true # accessibility check in the browser
  typst:
    pdf-standard: [a-2b, ua-1]
$ quarto render bulletin.qmd
[verapdf]: Validating bulletin.pdf against PDF/2B...PASSED
[verapdf]: Validating bulletin.pdf against PDF/UA1...PASSED

PDF/A is for the archive. PDF/UA is tagged for screen readers. Quarto checks both with veraPDF, and the web page with axe-core.

Thursday, 17:50, again

The key figure is wrong.

nights <- get_eurostat(
  "tour_occ_nim",
  filters = list(
    geo = "EU27_2020",
    unit = "NR",
    nace_r2 = "I551-I553",
    c_resid = "FOR"
  )
)

Country of residence: FOR = guests from abroad only

Thursday, 17:50, again

The key figure is wrong.

nights <- get_eurostat(
  "tour_occ_nim",
  filters = list(
    geo = "EU27_2020",
    unit = "NR",
    nace_r2 = "I551-I553",
    c_resid = "TOTAL"
  )
)

Country of residence: FOR = guests from abroad only → TOTAL = all guests

One render

quarto render bulletin.qmd

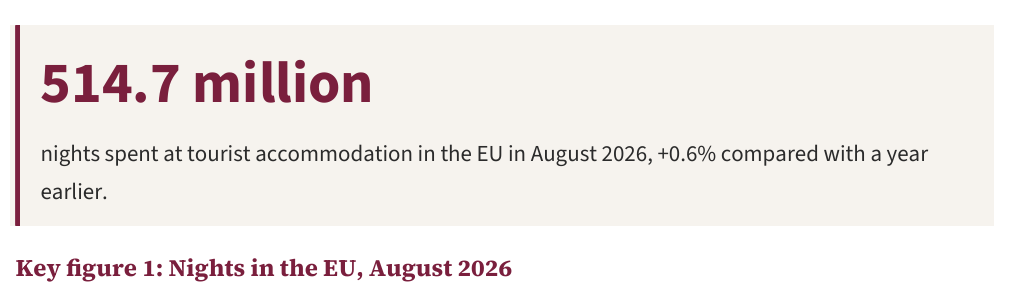
Key figure box of the HTML bulletin: 514.7 million nights spent at tourist accommodation in the EU in August 2026, +0.6% compared with a year earlier.

bulletin.html

The same key figure box in the PDF bulletin: 514.7 million nights in August 2026, +0.6% compared with a year earlier.

bulletin.pdf

The same key figure box in the Word bulletin: 514.7 million nights in August 2026, +0.6% compared with a year earlier.

bulletin.docx

Thursday, 17:51

One source file 245.0514.7

Word report 245.0514.7

PDF 245.0514.7

Chart 245.0514.7

Web page 245.0514.7

Press release 245.0514.7

All six show 514.7

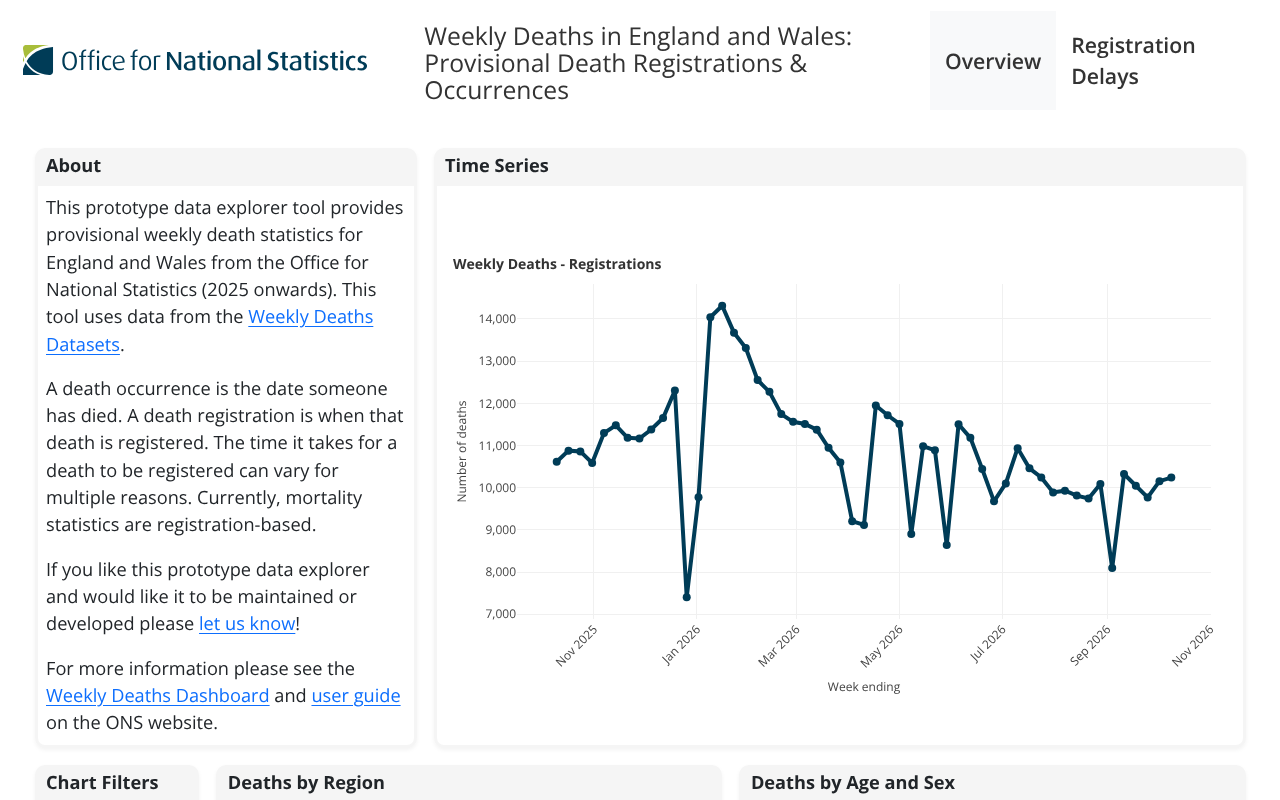
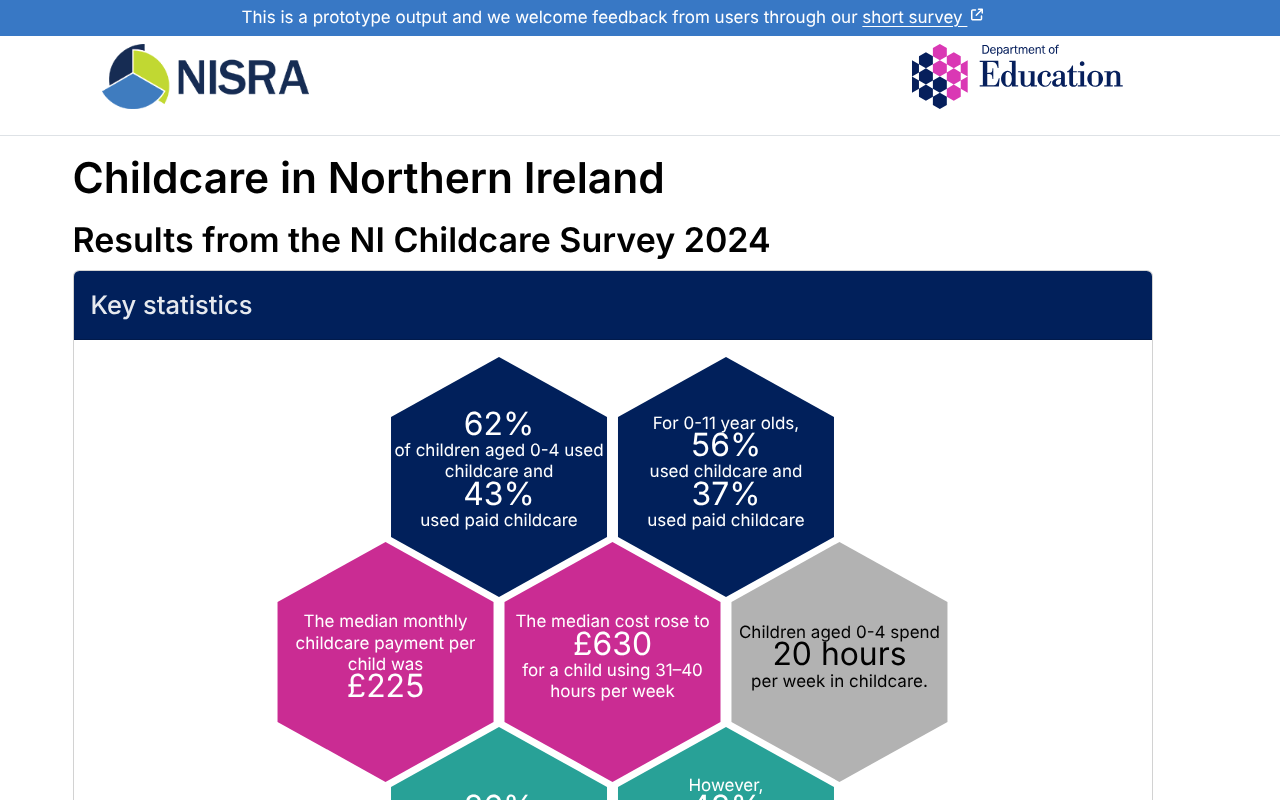
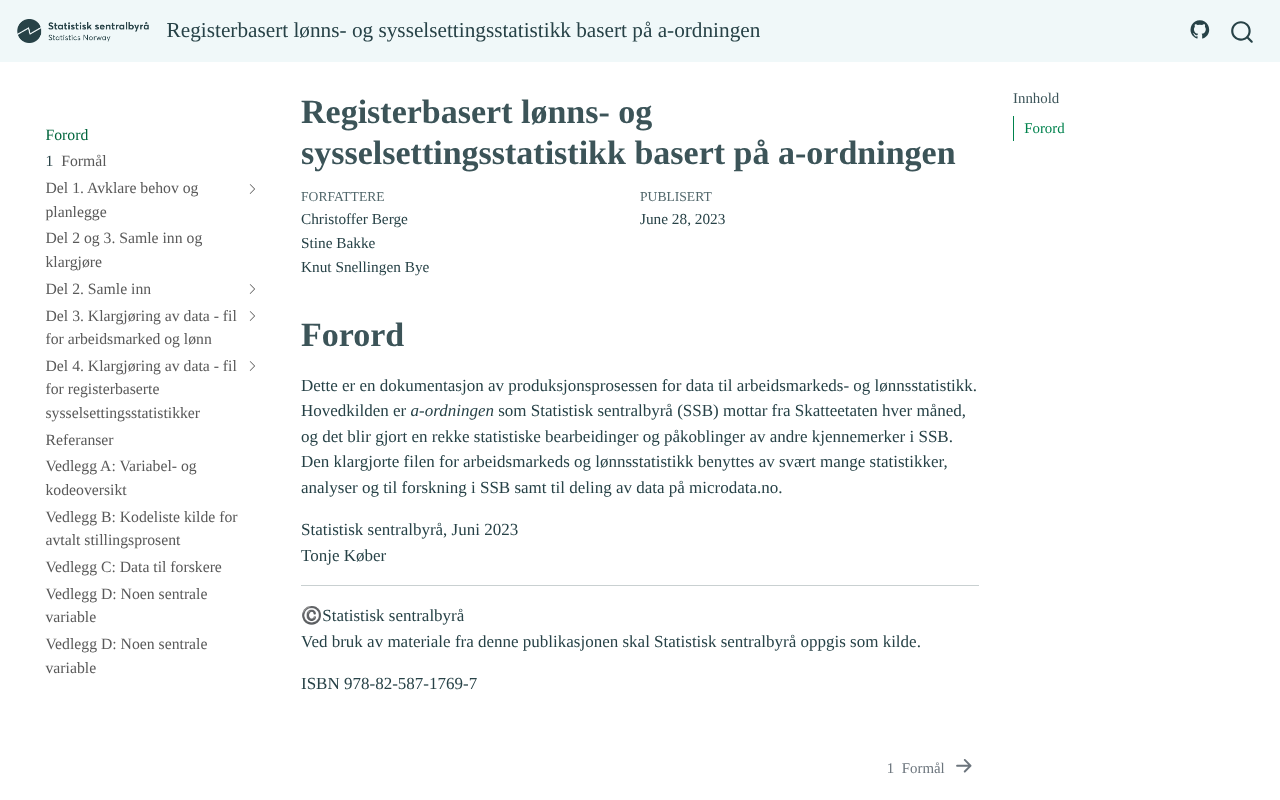
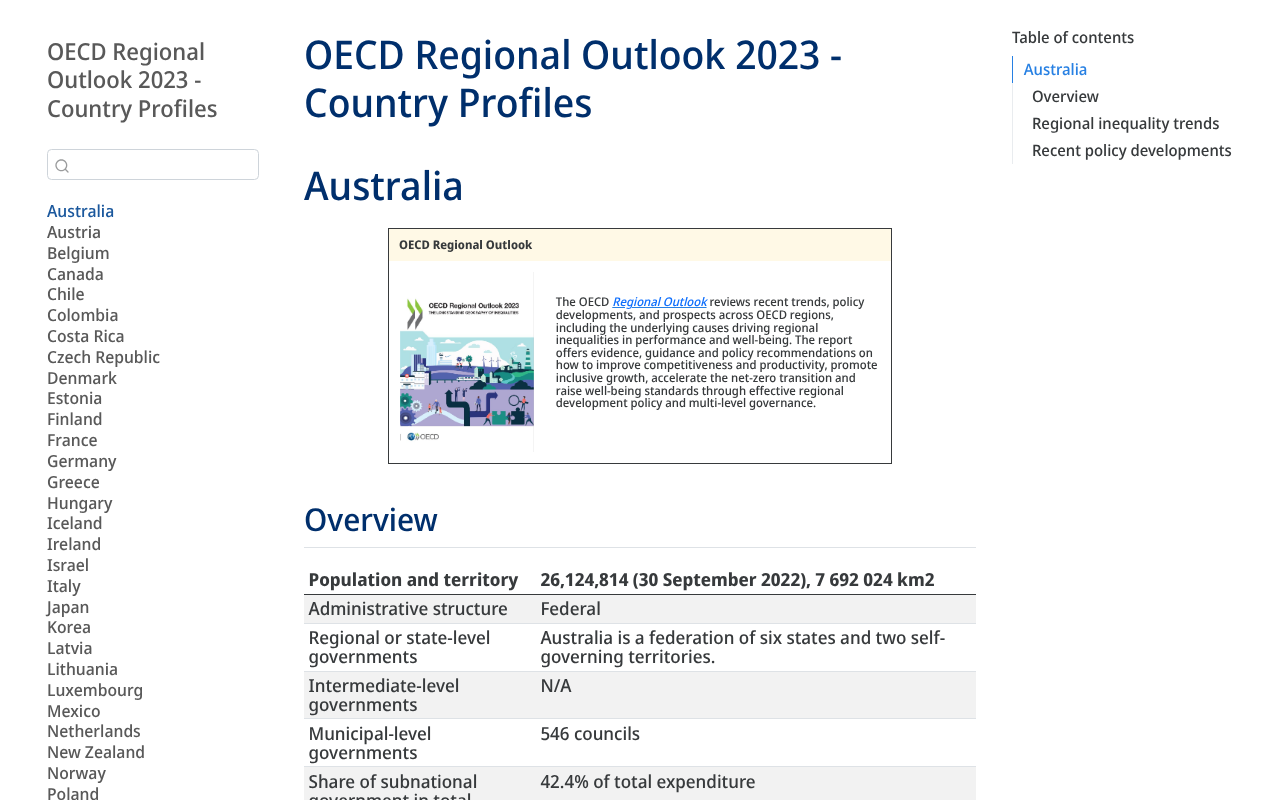
Already published with Quarto

France · Norway · United Kingdom · OECD
These slides are Quarto too.

From R Markdown to Quarto 2

R Markdown

R code and text, to HTML, PDF, Word

Quarto

Same idea, more languages and formats

Quarto 1

The version you install

Quarto 2

Faster, and writing together in the browser

Start with one monthly publication

Your .qmd file

Word report

PDF

Chart

Web page

Press release

Learning More

Slides

Example bulletin